Within Face Bias
How High Accuracy Hid Unequal AI Errors
High average scores can mask serious errors when benchmark examples mostly represent the easiest-served groups.
On this page
- Why headline accuracy looked reassuring
- How majority groups dominated benchmark scores
- What subgroup reporting reveals instead
Page outline Jump by section
Introduction
Facial-analysis systems often appeared highly accurate because their performance was summarised with a single headline number. The problem is that an average accuracy score can conceal who is benefiting from that accuracy and who is not. When benchmark datasets are dominated by groups that a system handles well, strong results for those groups can overwhelm poor results for smaller, underrepresented groups. As a result, a facial-analysis model may seem reliable overall while making frequent mistakes for darker-skinned women and other populations that appear less often in testing data. Research on facial-analysis systems showed that this was not a minor statistical quirk but a fundamental measurement problem: the way performance was reported hid important failures that became visible only when results were broken down by subgroup. [Proceedings of Machine Learning Research]proceedings.mlr.pressProceedings of Machine Learning ResearchGender Shades: Intersectional Accuracy Disparities in…by J Buolamwini · 2018 · Cited by 10870…

Why Headline Accuracy Looked Reassuring
A single accuracy score is attractive because it is easy to understand and compare. Developers, buyers and journalists can quickly see that a system is “95% accurate” or “98% accurate” and assume it works well for everyone.
The difficulty is that accuracy is an average. If most benchmark images come from groups that the system recognises correctly, those successes dominate the final score. Errors affecting a smaller share of the dataset have little influence on the overall result. A model can therefore receive an impressive benchmark score while still performing poorly for people who are underrepresented in the test set. [Proceedings of Machine Learning Research]proceedings.mlr.pressProceedings of Machine Learning ResearchGender Shades: Intersectional Accuracy Disparities in…by J Buolamwini · 2018 · Cited by 10870…
This mechanism is especially important in facial analysis because performance is not always distributed evenly across demographic groups. Researchers have repeatedly found that some face-analysis systems exhibit different error rates across categories such as skin tone, sex and age. When those differences are compressed into a single number, the disparities become difficult to detect. [NIST]nist.govstudy evaluates effects race age sex face recognition softwareNIST Study Evaluates Effects of Race, Age, Sex on Face…Dec 19, 2019 — A new NIST study examines how accurately face recognition so…
A useful analogy is a school exam. If 90% of the questions cover one topic and only 10% cover another, a student can achieve a high overall mark despite struggling with the less-tested subject. The overall score is not false, but it gives an incomplete picture of actual performance.
How Majority Groups Dominated Benchmark Scores
The masking effect became clearer when researchers examined the composition of widely used face datasets. The Gender Shades study found that influential benchmark datasets were heavily skewed toward lighter-skinned individuals, with approximately 79.6% lighter-skinned subjects in IJB-A and 86.2% in Adience. [Proceedings of Machine Learning Research]proceedings.mlr.pressProceedings of Machine Learning ResearchGender Shades: Intersectional Accuracy Disparities in…by J Buolamwini · 2018 · Cited by 10870…
Because these benchmarks contained many more examples from majority groups, performance on those groups contributed disproportionately to the final score. If a system correctly classified thousands of lighter-skinned male faces but frequently misclassified a much smaller number of darker-skinned female faces, the aggregate accuracy could still appear excellent. [Proceedings of Machine Learning Research]proceedings.mlr.pressProceedings of Machine Learning ResearchGender Shades: Intersectional Accuracy Disparities in…by J Buolamwini · 2018 · Cited by 10870…
The issue was not merely that darker-skinned women were underrepresented. It was that benchmark mathematics effectively weighted their experiences less heavily. Every image contributed to the average, but groups with far more images exerted far greater influence over the reported result.
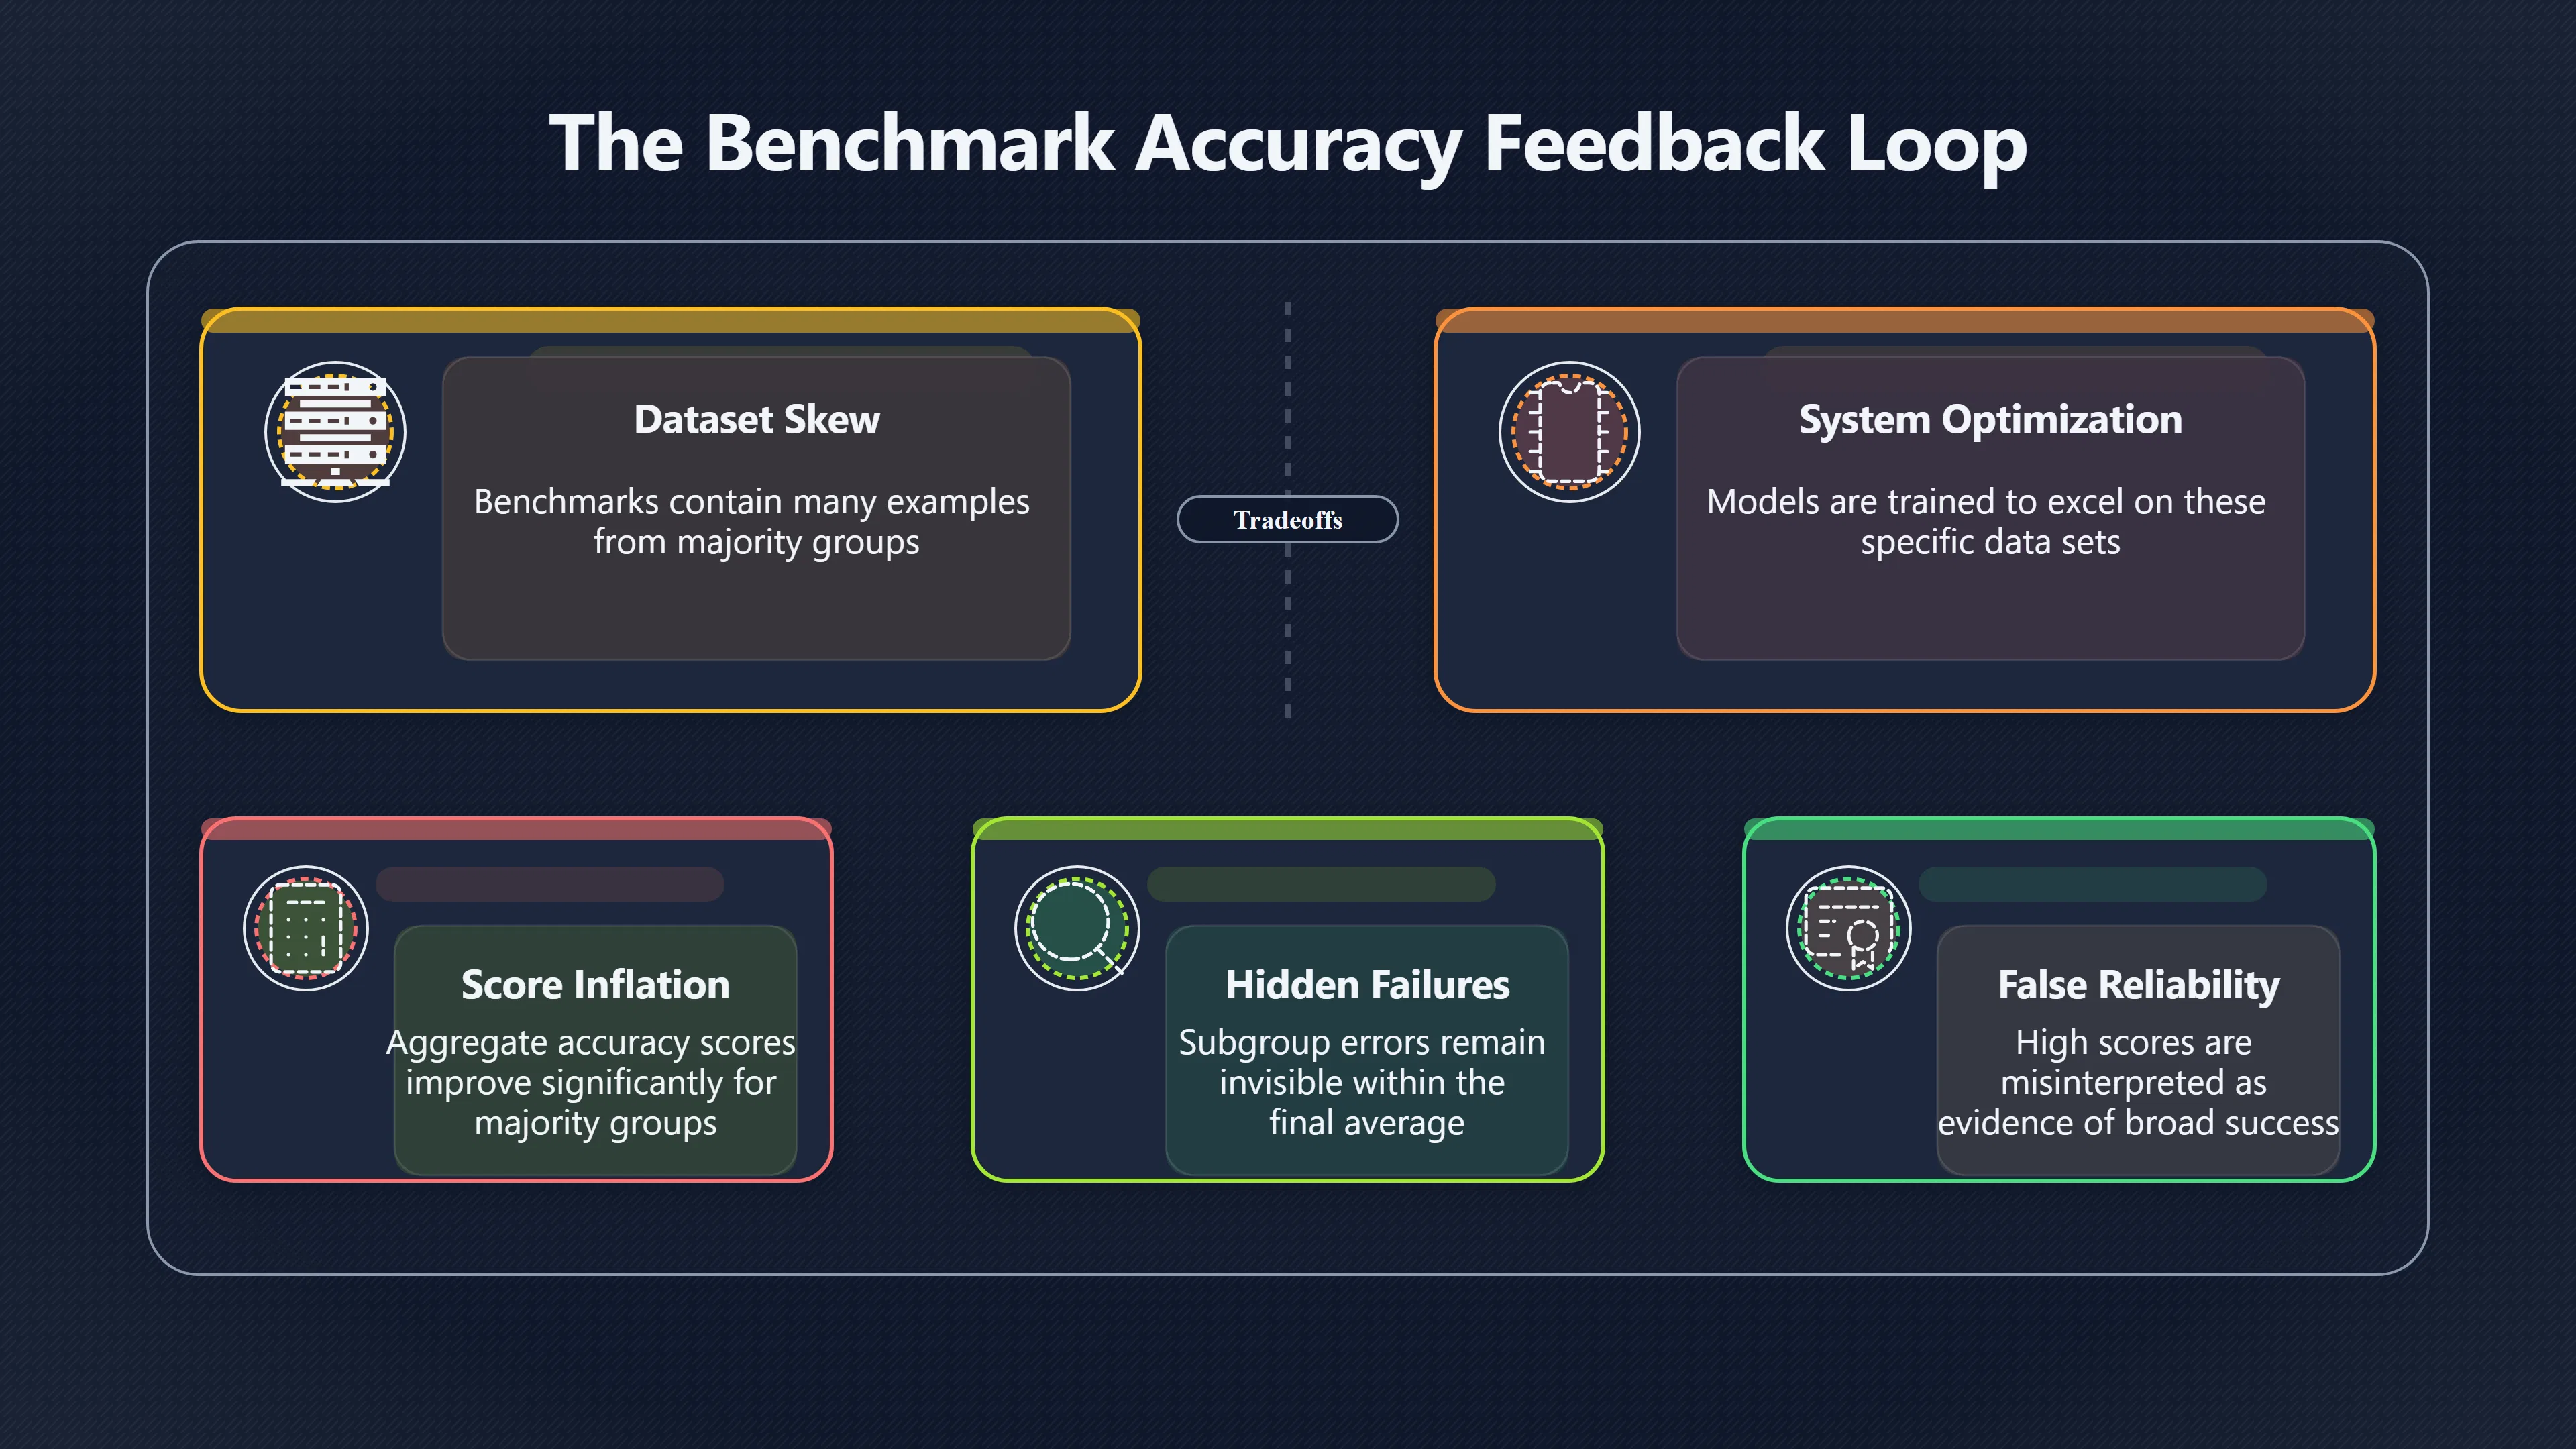
This creates a feedback loop:

- A benchmark contains many examples from majority groups.
- Systems are optimised to perform well on that benchmark.
- Aggregate scores improve.
- Subgroup failures remain hidden because they contribute little to the overall metric.
- High scores are interpreted as evidence of broad reliability.
The result is a system that appears successful according to the benchmark while still delivering uneven real-world performance.
What Subgroup Reporting Reveals Instead
The Gender Shades project demonstrated the value of reporting results separately for different demographic groups rather than relying solely on a single accuracy figure. When researchers examined four intersectional groups—lighter-skinned women, lighter-skinned men, darker-skinned women and darker-skinned men—the disparities became impossible to ignore. Across the commercial systems tested, darker-skinned women experienced error rates as high as 34.7%, while lighter-skinned men had error rates as low as 0.8%. Proceedings of Machine Learning Research+2Digital Government Hub [proceedings.mlr.press]proceedings.mlr.pressProceedings of Machine Learning ResearchGender Shades: Intersectional Accuracy Disparities in…by J Buolamwini · 2018 · Cited by 10870…
These findings changed the interpretation of system performance. Instead of asking, “How accurate is the model overall?”, researchers could ask more informative questions:
- Which groups experience the highest error rates? [digitalgovernmenthub.org]digitalgovernmenthub.orgGender Shades: Intersectional Accuracy Disparities in…Darker-skinned females experience the highest misclassification rates (up to 34…
- Are errors distributed evenly?
- Does accuracy remain consistent across demographic categories?
- Are certain users exposed to much greater risk of misclassification?
Subgroup reporting transforms a single average into a performance profile. It reveals whether a system succeeds uniformly or whether its success depends on who is being evaluated. [Proceedings of Machine Learning Research]proceedings.mlr.pressProceedings of Machine Learning ResearchGender Shades: Intersectional Accuracy Disparities in…by J Buolamwini · 2018 · Cited by 10870…
The importance of this approach has been reinforced by later evaluations. Large-scale testing by the US National Institute of Standards and Technology (NIST) found demographic differentials in many facial-recognition algorithms, showing that error rates could vary substantially across demographic groups even when systems appeared accurate overall. In some scenarios, false-positive rates differed by factors of ten to one hundred between groups. [NIST+2Scientific American]nist.govstudy evaluates effects race age sex face recognition softwareNIST Study Evaluates Effects of Race, Age, Sex on Face…Dec 19, 2019 — A new NIST study examines how accurately face recognition so…

Why This Became a Broader AI Evaluation Lesson
The lesson extends beyond facial analysis. The core problem is not facial recognition itself but the use of aggregate metrics to evaluate systems that interact with diverse populations.
Averages answer the question, “How did the system perform overall?” They do not answer, “Who experienced the errors?” When benchmark datasets are imbalanced, overall accuracy can create a misleading sense of reliability because the experiences of smaller groups become statistically diluted.
The response from researchers has increasingly been to supplement aggregate scores with subgroup analysis, demographic breakdowns and intersectional evaluation. Rather than treating fairness as separate from accuracy, this approach recognises that understanding accuracy requires knowing how it is distributed across different people. Proceedings of Machine Learning Research+2NIST Pages [proceedings.mlr.press]proceedings.mlr.pressProceedings of Machine Learning ResearchGender Shades: Intersectional Accuracy Disparities in…by J Buolamwini · 2018 · Cited by 10870…
In the case of face AI, the headline numbers were not necessarily wrong. They were incomplete. The crucial failures only became visible when researchers stopped looking at the average and started examining who was hidden inside it. [Proceedings of Machine Learning Research]proceedings.mlr.pressProceedings of Machine Learning ResearchGender Shades: Intersectional Accuracy Disparities in…by J Buolamwini · 2018 · Cited by 10870…
Amazon book picks
Further Reading
Books and field guides related to How High Accuracy Hid Unequal AI Errors. Use these as the next step if you want deeper reading beyond the article.
Weapons of Math Destruction
Directly addresses how headline scores can hide unequal outcomes.
eBay marketplace picks
Marketplace Samples
Example marketplace items related to this page. Use the search link to explore similar finds on eBay.


Endnotes
-
Source: nist.gov
Title: study evaluates effects race age sex face recognition software
Link: https://www.nist.gov/news-events/news/2019/12/nist-study-evaluates-effects-race-age-sex-face-recognition-softwareSource snippet
NIST Study Evaluates Effects of Race, Age, Sex on Face...Dec 19, 2019 — A new NIST study examines how accurately face recognition so...
-
Source: pages.nist.gov
Title: Pages Demographic Effects in Face Recognition
Link: https://pages.nist.gov/frvt/html/frvt_demographics.htmlSource snippet
NIST PagesDemographic Effects in Face Recognition - NIST PagesThis page summarizes and links to all FRTE data and reports related to demo...
-
Source: nvlpubs.nist.gov
Link: https://nvlpubs.nist.gov/nistpubs/ir/2019/nist.ir.8280.pdfSource snippet
NIST PublicationsFace Recognition Vendor Test (FRVT), Part 3: Demographic...by P Grother · 2019 · Cited by 93 — This report provides det...
-
Source: pages.nist.gov
Title: Pages Face Recognition Vendor Test (FRVT) Part 8
Link: https://pages.nist.gov/frvt/reports/demographics/nistir_8429.pdfSource snippet
NIST PagesFace Recognition Vendor Test (FRVT) Part 8 - NIST Pagesby P Grother · 2022 · Cited by 24 — To those ends, this report compiles...
-
Source: nist.gov
Link: https://www.nist.gov/Source snippet
National Institute of Standards and TechnologyNIST promotes U.S. innovation and industrial competitiveness by advancing measurement scien...
-
Source: nist.gov
Link: https://www.nist.gov/programs-projects/face-recognition-vendor-test-frvtSource snippet
n this report, NISTIR 8280. NIST has conducted tests...Read more...
-
Source: nist.gov
Title: facial recognition technology part iii ensuring commercial transparency accuracy
Link: https://www.nist.gov/speech-testimony/facial-recognition-technology-part-iii-ensuring-commercial-transparency-accuracySource snippet
Facial Recognition Technology (Part III): Ensuring...Jan 15, 2020 — For most algorithms, the NIST study measured higher [false positives]({{ 'false-positives/' | relative_url }})...
-
Source: proceedings.mlr.press
Link: https://proceedings.mlr.press/v81/buolamwini18a.htmlSource snippet
Proceedings of [Machine Learning]({{ 'machine-learning/' | relative_url }}) ResearchGender Shades: Intersectional Accuracy Disparities in...by J Buolamwini · 2018 · Cited by 10870...
-
Source: proceedings.mlr.press
Link: https://proceedings.mlr.press/v81/buolamwini18a/buolamwini18a.pdfSource snippet
Proceedings of Machine Learning ResearchGender Shades: Intersectional Accuracy Disparities in...by J Buolamwini · 2018 · Cited by 10870...
-
Source: digitalgovernmenthub.org
Link: https://digitalgovernmenthub.org/library/gender-shades-intersectional-accuracy-disparities-in-commercial-gender-classification/Source snippet
Gender Shades: Intersectional Accuracy Disparities in...Darker-skinned females experience the highest misclassification rates (up to 34...
-
Source: scientificamerican.com
Title: how nist tested facial recognition algorithms for racial bias
Link: https://www.scientificamerican.com/article/how-nist-tested-facial-recognition-algorithms-for-racial-bias/Source snippet
How NIST Tested Facial-Recognition Algorithms for Racial...27 Dec 2019 — Along with other findings, NIST's tests revealed that many of t...
-
Source: Wikipedia
Title: National Institute of Standards and Technology
Link: https://en.wikipedia.org/wiki/National_Institute_of_Standards_and_TechnologySource snippet
National Institute of Standards and TechnologyThe National Institute of Standards and Technology (NIST) is an agency of the United Sta...
Additional References
-
Source: openaccess.thecvf.com
Link: https://openaccess.thecvf.com/content/CVPR2026W/ABAW/papers/Ferre_Deconfounding_Demographic_Bias_Estimation_in_Facial_Expression_Recognition_CVPRW_2026_paper.pdfSource snippet
Demographic Bias Estimation in Facial...by I Ferre · 2026 — It is usually measured by di- rectly comparing aggregated performance metric...
-
Source: darktrace.com
Link: https://www.darktrace.com/cyber-ai-glossary/national-institute-of-standards-and-technology-nistSource snippet
What is NIST? | Definition & ExamplesThe National Institute of Standards and Technology (NIST) is the federal technology agency that deve...
-
Source: gendershades.org
Link: https://gendershades.org/overview.html -
Source: researchgate.net
Link: https://www.researchgate.net/publication/224238108_Demographic_effects_on_estimates_of_automatic_face_recognition_performanceSource snippet
Demographic effects on estimates of automatic face...Specifically, these studies suggested that face recognition is less accurate for fe...
-
Source: fr.scribd.com
Link: https://fr.scribd.com/document/470788356/Gender-Shades-Intersectional-Accuracy-Disparities-in-Commercial-Gender-Classification-pdfSource snippet
Terms of Service). None of the commercial gen- faces (20.8% − 34.7% error rate) der classifiers chosen for...Read more...
-
Source: youtube.com
Link: https://www.youtube.com/watch?v=TWWsW1w-BVoSource snippet
Gender ShadesI wanted to see how well different gender classification systems worked across different peoples faces and if the results ch...
-
Source: maquinacoes.rafaelg.net.br
Link: https://maquinacoes.rafaelg.net.br/gender-shadesSource snippet
The substantial disparities in the accuracy of classifying darker females, lighter females, darker...Read more...
-
Source: klover.ai
Title: dr timnit gebru translating gender shades into corporate governance
Link: https://www.klover.ai/dr-timnit-gebru-translating-gender-shades-into-corporate-governance/Source snippet
Timnit Gebru: Translating 'Gender Shades' into...Jun 23, 2025 — The media seized on the report's central figure: a 34.7% error rate for...
-
Source: just-tech.ssrc.org
Link: https://just-tech.ssrc.org/citation/gender-shades-intersectional-accuracy-disparities-in-commercial-gender-classi%EF%AC%81cation/Source snippet
The substantial disparities in the accuracy of classifying darker females, lighter females, darker...Read more...
-
Source: securityindustry.org
Title: what nist data shows about facial recognition and demographics
Link: https://www.securityindustry.org/report/what-nist-data-shows-about-facial-recognition-and-demographics/Source snippet
What NIST Data Shows About Facial Recognition and...6 Feb 2020 — NIST did find relatively higher false positive effects for some groups...
Topic Tree